
Updated August 2026. The framework in this article still holds, though some examples and year references had gone stale. It was reviewed in August 2026 so traders can read it as a current guide rather than an archived explainer.
The past often repeats itself, and that is especially true in the stock market. Investors who spend time studying how assets behave under different conditions can often spot similar setups in the current market. A close look at how assets gained and lost value historically can surface consistent patterns that, combined with extra analysis of relevant factors, can support a more accurate read of future performance.
One way to collect that information is to study trading chart patterns. These are shapes that appear on a stock chart and hint at what a given stock might do based on what it did before. Once you can recognize those shapes and what they imply, you can make more informed decisions whether the market is rising or falling.
Black Eagle Financial Group es uno de los más respetados empresas de negociación por cuenta propia en NYC. Hemos preparado esta guía para describir los patrones de gráficos de precios más utilizados y lo que significan para que pueda implementarlos en sus actividades de trading.
Categorías de patrones de análisis técnico
Traders study past asset performance using three categories of stock chart patterns. Most assets see each of them at some point.
Continuación
La tendencia actual va camino de continuar en la misma trayectoria.
Reversión
El rumbo actual cambiará de dirección.
Bilateral
La volatilidad del mercado podría hacer que la tendencia virara en cualquier dirección.
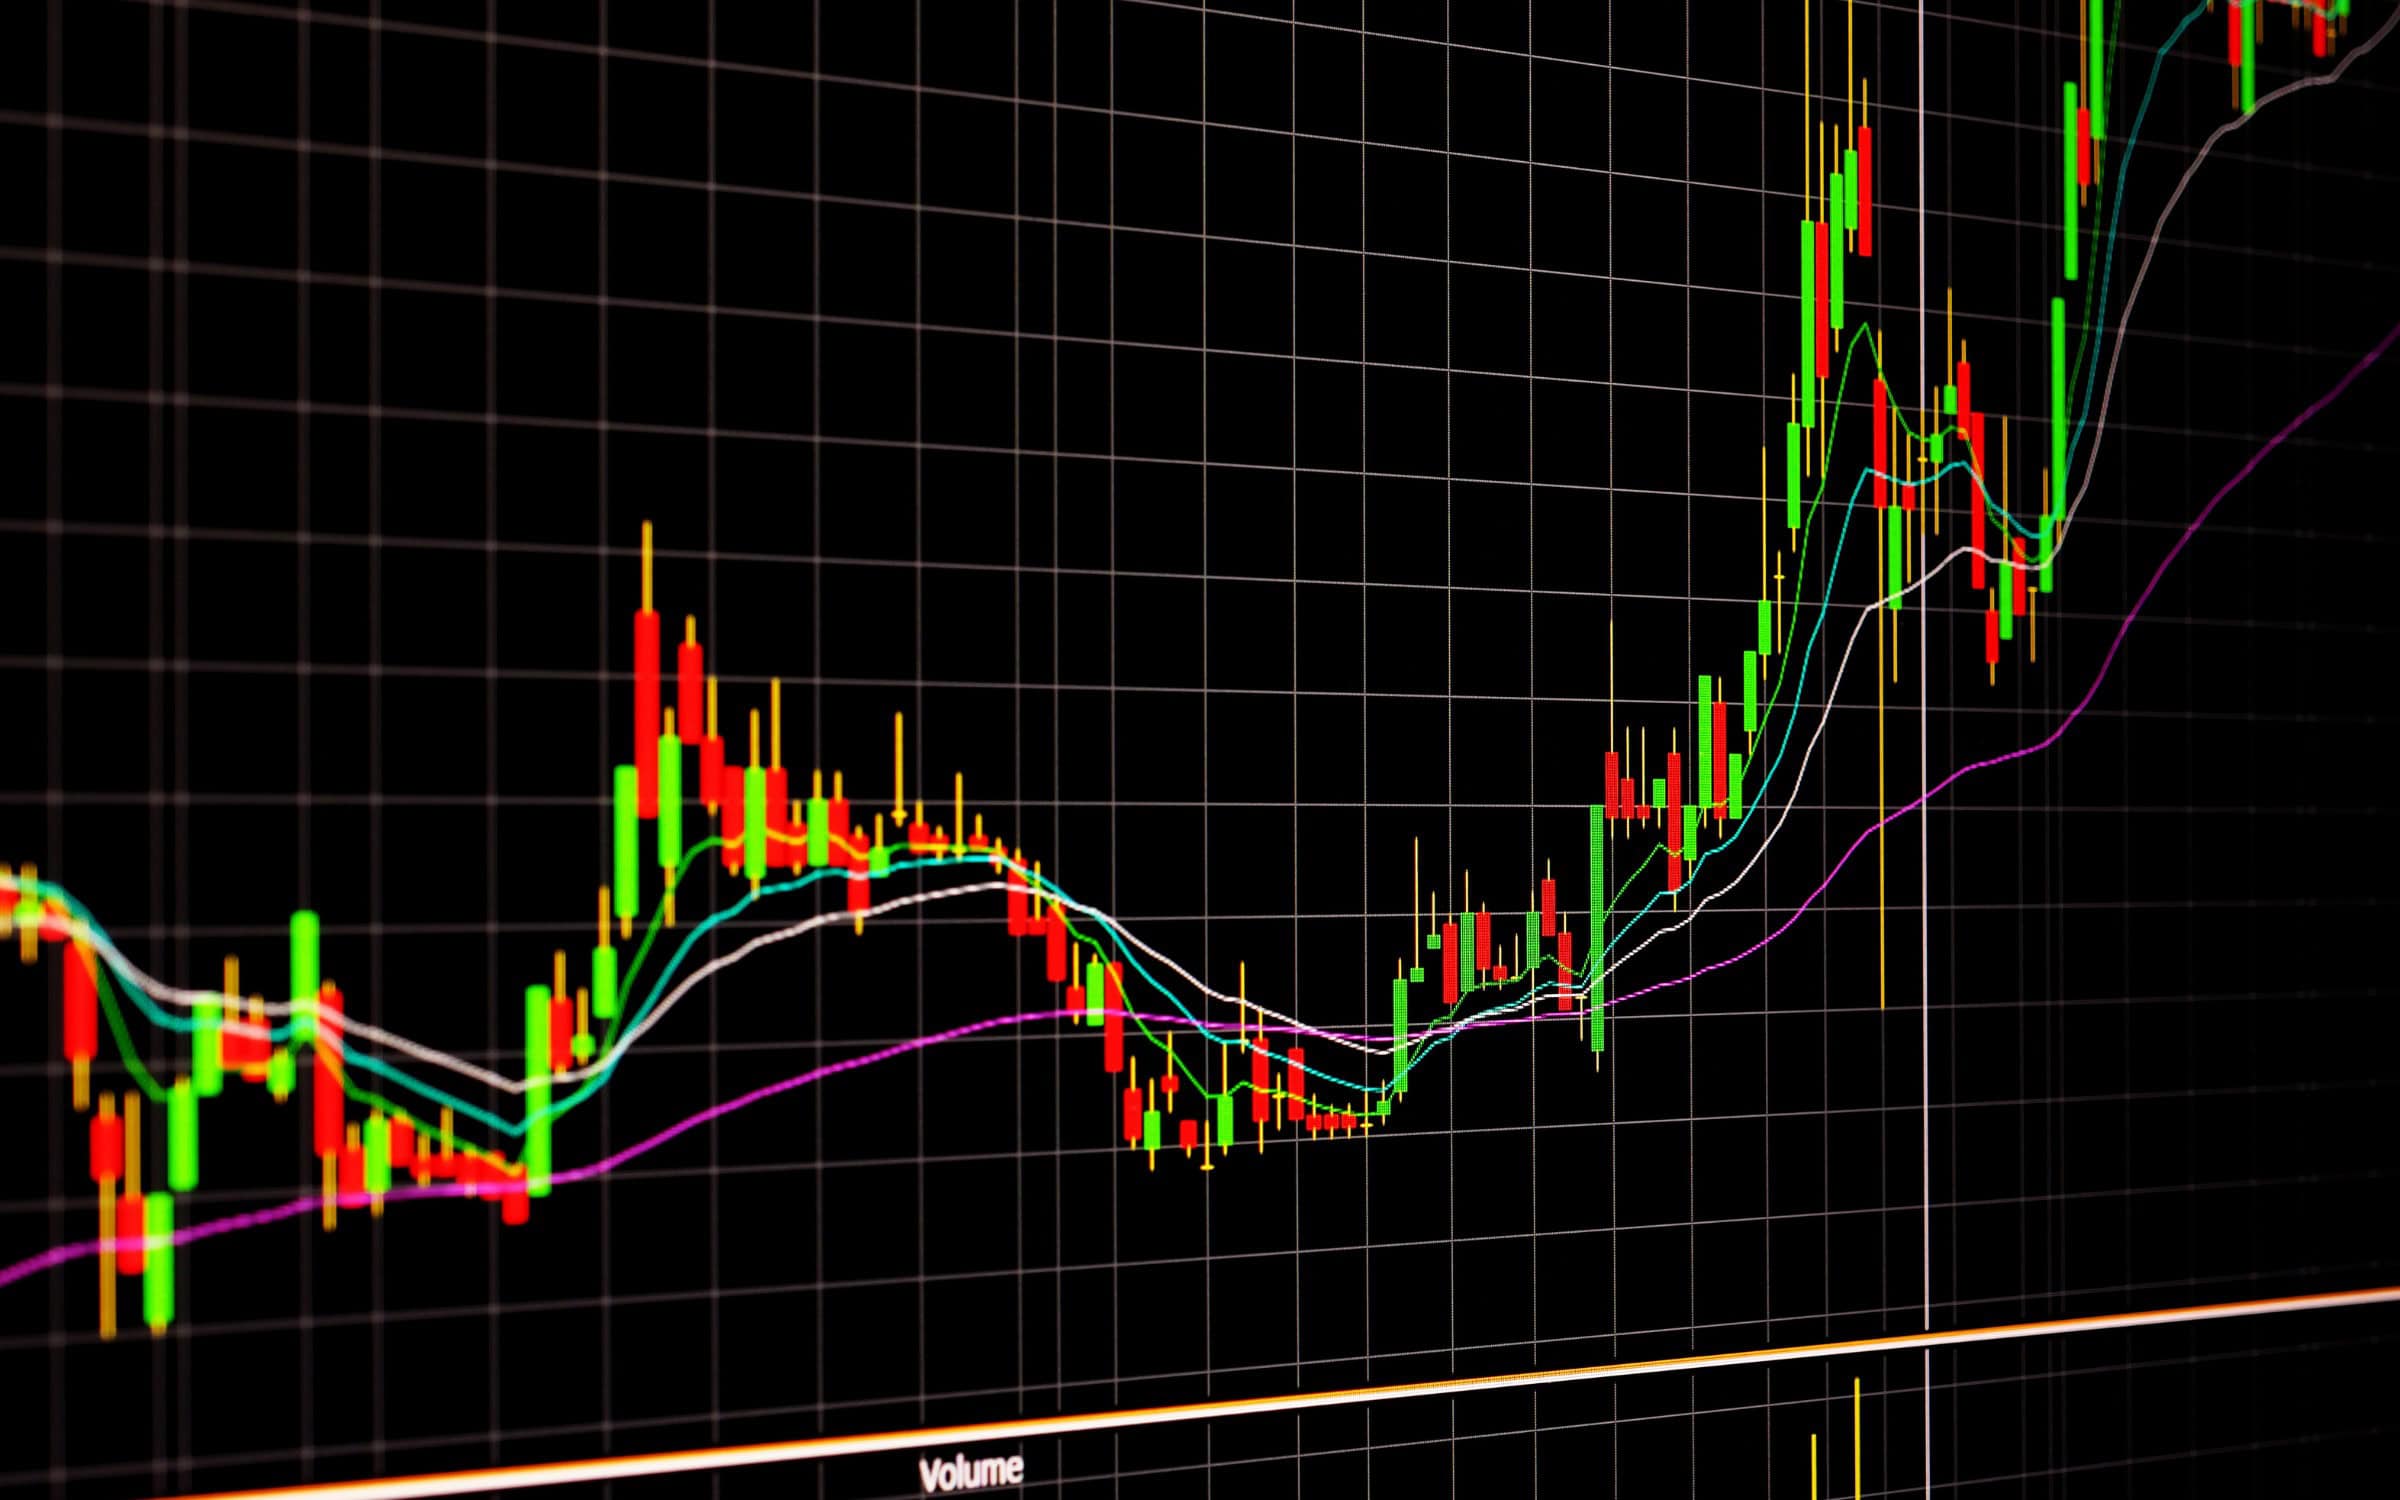
Operaciones con velas typically relies on trading chart patterns. Traders track candlestick patterns to anticipate market moves using the shape and color of the candlesticks on the chart.
Applying patterns to performance can identify trends, but none are 100% accurate. At most, there’s about an 89% chance that you can make an accurate prediction based on a chart, so investors and traders should never rely entirely on this type of technical analysis as their only tool.
Cómo influyen la resistencia y el soporte en el desarrollo de patrones
Knowing where support and resistance sit is essential when you build trading strategies around chart patterns.
El soporte es el nivel en el que el precio de la acción deja de caer e inicia una tendencia alcista. La resistencia es lo contrario: la subida se estanca y el precio del activo empieza a bajar.
Los patrones gráficos más eficaces y precisos utilizados para el análisis técnico
La mayoría de los operadores utilizan estos patrones de análisis técnico para analizar las tendencias del mercado:
1. Escaleras de ascenso y descenso
Stock prices do not rise or fall in a straight line. They move in small increments. If they keep heading in one general direction, though, they form an ascending or descending staircase.
Staircases can point to chances to act quickly on short-term market changes. Selling an asset that’s on a general downward trend when it’s experiencing a small upward blip, for example, can limit losses.
2. Cabeza y hombros
A head and shoulders pattern shows a high peak with slightly lower ones on either side. They typically flag a downward reversal because, although each peak falls back to the same support, once the third peak hits that level, the asset usually starts trending lower.
3. Doble fondo
A double-bottom trend typically flags an upward reversal. It shows up during a stretch of selling that drops the asset to support. Price then moves up toward resistance, falls back to support, and then starts moving higher again in a generally positive direction.
4. Parte superior e inferior redondeadas
Rounded top or bottom trading chart patterns also signal reversals. The rounded top is an inverted U that shows assets trending downward, while the rounded bottom is the opposite: a U shape showing an upward trend. These are typically gradual changes that show up over several trading sessions.
5. Banderines o banderas
Stretches of upward momentum followed by consolidation and decline form a pennant or flag on the chart. The pennant shape appears because there is usually an initial burst of large increases followed by smaller fluctuations.
6. Cuña
When an asset’s price stays between two sloping support and resistance lines, that is a wedge pattern. A rising wedge has a steeper support line, pointing to a more lasting price decline when it breaks below that line. A falling wedge has a steeper resistance line, showing that the price can keep rising even after it passes that line.
7. Taza y asa
A cup and handle is a continuation pattern that combines the rounded bottom and wedge patterns. The U of the cup shows a gradual upward trend until the asset goes through a stretch where price declines, but only inside the two parallel lines of a wedge-type graph. Eventually, price tends to break through resistance and resume the upward trend.
8. Triángulo simétrico
Watching a symmetrical triangle is useful in a volatile market, because it is a bilateral pattern that can hint at the stock’s overall direction. These triangles form when prices converge as highs get lower and lows get higher.
Puede que no haya una indicación clara de hacia dónde se moverá el valor antes de que se forme el triángulo. Sin embargo, una vez que lo haga, prepárese para una ruptura en cualquier dirección.
Tome las decisiones comerciales más informadas con Black Eagle Financial Group
Mediante la combinación de elementos de un fondo de cobertura y una empresa de servicios financieros, Black Eagle Financial Group se esfuerza por ayudar a los operadores a maximizar sus resultados con apoyo, herramientas y recursos que les ayuden a desarrollar sus habilidades y llevar sus inversiones a nuevas alturas. Con guías de expertos, información sobre psicología del tradingy apoyo para asegurar su capital, gestionar los riesgos y mantener el cumplimiento, le ayudaremos a alcanzar sus objetivos sin costes ni riesgos excesivos.
Conéctese con nosotros llamando al (833) 253-2453 y aprenda más sobre el uso de patrones gráficos de trading como parte de una estrategia de inversión rentable.
Preguntas frecuentes
Repase estas preguntas habituales sobre los patrones de los gráficos bursátiles y cómo utilizarlos.
¿Cuál es la mejor forma de aprender a operar con patrones gráficos?
La mejor manera de aprender a reconocer e interpretar los patrones de los gráficos de negociación es compararlos con los datos históricos para ver cómo fluctúan los precios en distintas condiciones de mercado. Utilice algoritmos de reconocimiento de patrones gráficos para aplicar distintas opciones a la información anterior y ver dónde se solapan.
¿Son precisos los patrones?
No, los patrones de los gráficos bursátiles no siempre son infalibles; como mucho, funcionan para predecir tendencias entre el 50% y el 89% de las veces. Pueden mostrar señales falsas, así que combínelos con otros indicadores y métodos de análisis para obtener la imagen más completa.
¿Qué patrón es mejor para operar?
La mayoría de los expertos coinciden en que la cabeza y los hombros son los patrones gráficos más fiables, especialmente para detectar los cambios de tendencia.
¿Qué horizonte temporal utilizan los inversores para identificar los patrones de precios?
Los plazos diarios o semanales que identifican el curso de un activo son útiles para identificar patrones a largo plazo. Los intervalos más cortos (como cada cinco o quince minutos) facilitan la detección de los mejores puntos de entrada y salida.
Current as of August 2026
Markets in 2026 still pay for the same unglamorous skills: reading structure, defining risk before entry, and skipping setups that only work in a backtest. What changed is the environment around those skills — faster options expiry, more retail 0DTE flow, and more prop-firm offers that look like careers but are paid tests. Use this page for the core idea (pattern, strategy, career path, or regulation). Then check current contract specs, firm agreements, and hiring reality before you act on it. Where the original draft treated a past year as “now,” this revision treats August 2026 as now.