

Updated August 2026. The framework in this article still holds, though some examples and year references had gone stale. It was reviewed in August 2026 so traders can read it as a current guide rather than an archived explainer.
The past often repeats itself, and that is especially true in the stock market. Investors who spend time studying how assets behave under different conditions can often spot similar setups in the current market. A close look at how assets gained and lost value historically can surface consistent patterns that, combined with extra analysis of relevant factors, can support a more accurate read of future performance.
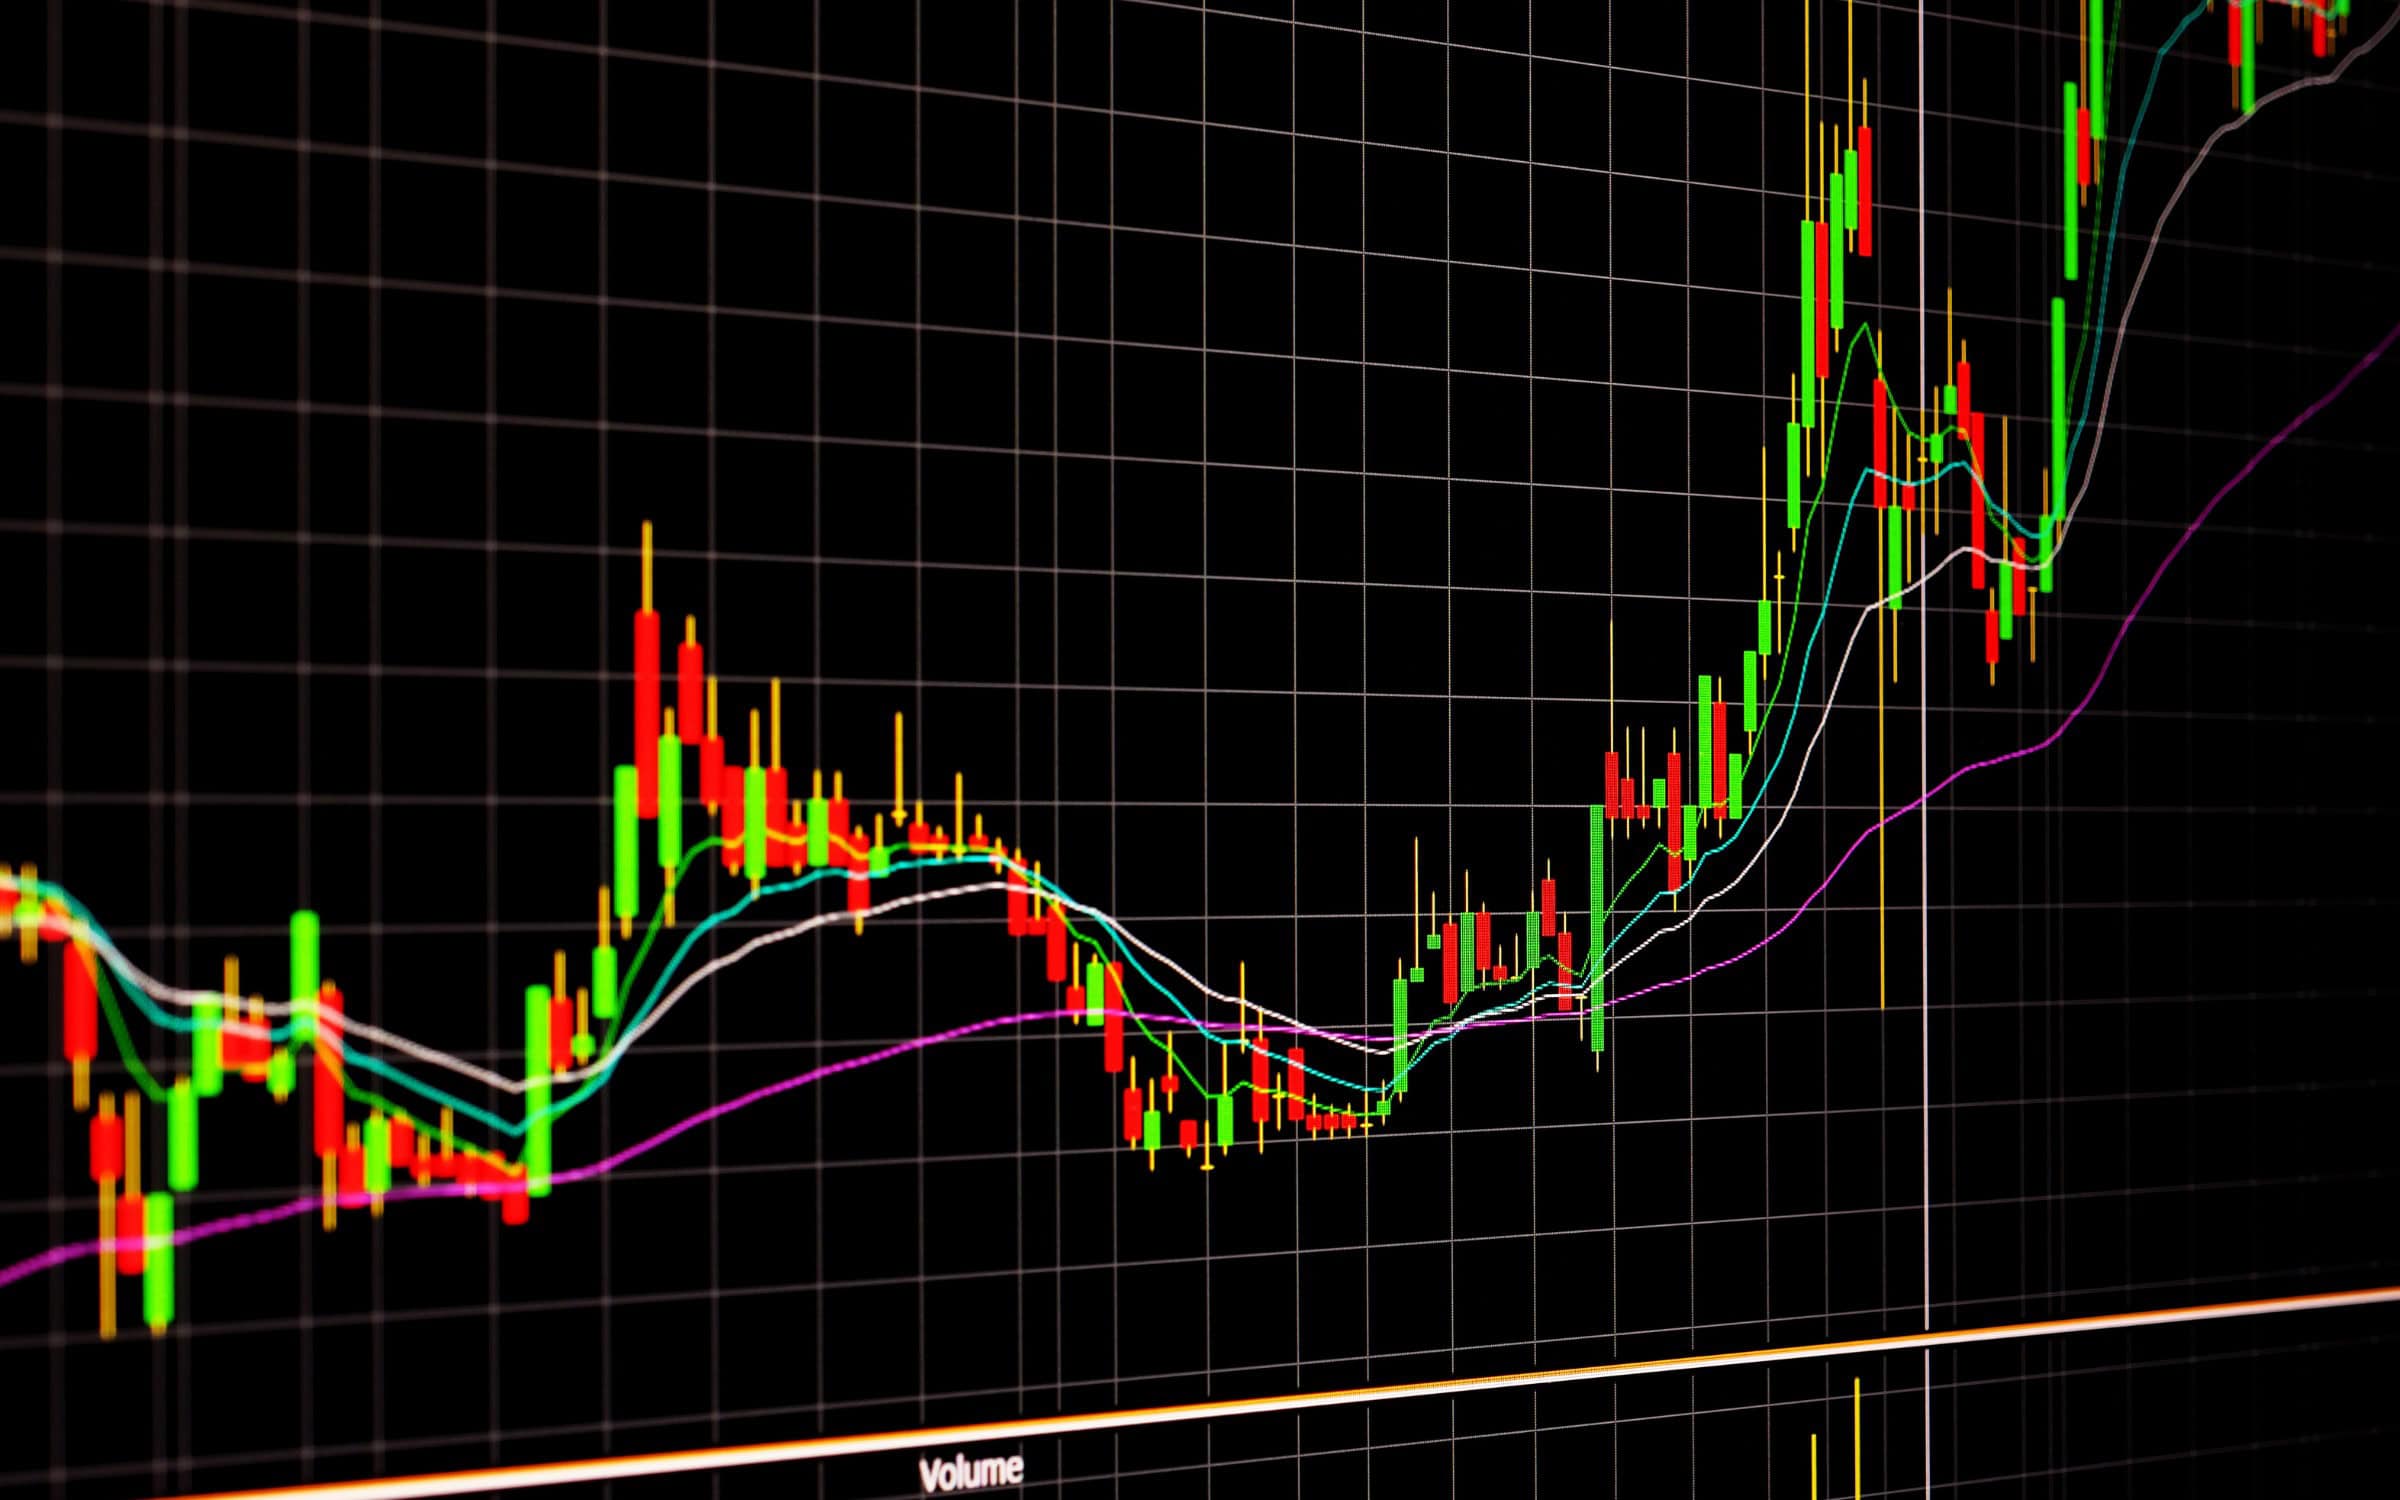
One way to collect that information is to study trading chart patterns. These are shapes that appear on a stock chart and hint at what a given stock might do based on what it did before. Once you can recognize those shapes and what they imply, you can make more informed decisions whether the market is rising or falling.
Black Eagle Financial Group е една от най-уважаваните Фирми за търговия със собствени средства в Ню Йорк. Подготвихме това ръководство, за да опишем най-често използваните модели на ценови графики и какво означават те, за да можете да ги приложите в търговската си дейност.
Технически анализ Pattern Категории
Traders study past asset performance using three categories of stock chart patterns. Most assets see each of them at some point.
Продължение
Настоящата тенденция е на път да продължи в същия дух.
Обръщане
Текущият курс ще промени посоката си.
Двустранни
Волатилността на пазара може да доведе до промяна на тенденцията в двете посоки.
Търговия със свещи typically relies on trading chart patterns. Traders track candlestick patterns to anticipate market moves using the shape and color of the candlesticks on the chart.
Applying patterns to performance can identify trends, but none are 100% accurate. At most, there’s about an 89% chance that you can make an accurate prediction based on a chart, so investors and traders should never rely entirely on this type of technical analysis as their only tool.
Как съпротивата и подкрепата информират за развитието на модела
Knowing where support and resistance sit is essential when you build trading strategies around chart patterns.
Подкрепата е нивото, при което цената на акциите спира да пада и започва възходяща тенденция. Съпротивата е обратното: нарастването спира и цената на актива започва да спада.
Най-ефективните и точни модели на графики, използвани за технически анализ
Повечето търговци използват тези модели за технически анализ, за да анализират пазарните тенденции:
1. Изкачване и слизане по стълбища
Stock prices do not rise or fall in a straight line. They move in small increments. If they keep heading in one general direction, though, they form an ascending or descending staircase.
Staircases can point to chances to act quickly on short-term market changes. Selling an asset that’s on a general downward trend when it’s experiencing a small upward blip, for example, can limit losses.
2. Глава и рамене
A head and shoulders pattern shows a high peak with slightly lower ones on either side. They typically flag a downward reversal because, although each peak falls back to the same support, once the third peak hits that level, the asset usually starts trending lower.
3. Двойно дъно
A double-bottom trend typically flags an upward reversal. It shows up during a stretch of selling that drops the asset to support. Price then moves up toward resistance, falls back to support, and then starts moving higher again in a generally positive direction.
4. Заоблени горна и долна част
Rounded top or bottom trading chart patterns also signal reversals. The rounded top is an inverted U that shows assets trending downward, while the rounded bottom is the opposite: a U shape showing an upward trend. These are typically gradual changes that show up over several trading sessions.
5. Знаменца или флагове
Stretches of upward momentum followed by consolidation and decline form a pennant or flag on the chart. The pennant shape appears because there is usually an initial burst of large increases followed by smaller fluctuations.
6. Клин
When an asset’s price stays between two sloping support and resistance lines, that is a wedge pattern. A rising wedge has a steeper support line, pointing to a more lasting price decline when it breaks below that line. A falling wedge has a steeper resistance line, showing that the price can keep rising even after it passes that line.
7. Чаша и дръжка
A cup and handle is a continuation pattern that combines the rounded bottom and wedge patterns. The U of the cup shows a gradual upward trend until the asset goes through a stretch where price declines, but only inside the two parallel lines of a wedge-type graph. Eventually, price tends to break through resistance and resume the upward trend.
8. Симетричен триъгълник
Watching a symmetrical triangle is useful in a volatile market, because it is a bilateral pattern that can hint at the stock’s overall direction. These triangles form when prices converge as highs get lower and lows get higher.
Възможно е да няма ясни индикации за това в каква посока ще се движи стойността преди образуването на триъгълника. Въпреки това, след като това стане, подгответе се за пробив в двете посоки.
Вземайте най-информираните решения за търговия с Black Eagle Financial Group
Съчетавайки елементи на хедж фонд и фирма за финансови услуги, Black Eagle Financial Group се стреми да помогне на търговците да увеличат резултатите си с подкрепа, инструменти и ресурси, които им помагат да развият уменията си и да издигнат инвестициите си до нови висоти. С експертни ръководства, прозрения за психология на търговията, както и подкрепа за осигуряване на вашия капитал, управление на рисковете и поддържане на съответствие, ние ще ви помогнем да постигнете целите си без прекомерни разходи или рискове.
Свържете се с нас, като се обадите на телефон (833) 253-2453, и научете повече за използването на моделите на търговските графики като част от печеливша инвестиционна стратегия.
Често задавани въпроси
Разгледайте тези често срещани въпроси за моделите на борсовите графики и как да ги използвате.
Кой е най-добрият начин да научите моделите на графиките за търговия?
Най-добрият начин да се научите да разпознавате и тълкувате моделите на графиките за търговия е да ги сравнявате с исторически данни, за да видите как цените се колебаят при различни пазарни условия. Използвайте алгоритми за разпознаване на модели на графики, за да прилагате различни варианти към предишна информация, за да видите къде се припокриват.
Точни ли са моделите?
Не, моделите на борсовите графики невинаги са безпогрешни; те работят най-много за прогнозиране на тенденциите в 50% до 89% от случаите. Те могат да показват фалшиви сигнали, затова ги комбинирайте с други индикатори и методи за анализ, за да получите най-пълна картина.
Кой модел е най-добър за търговия?
Повечето експерти са съгласни, че главата и раменете са най-надеждните модели на графики за търговия, особено за откриване на обръщане на тенденцията.
Каква времева рамка използват инвеститорите, за да идентифицират моделите на ценообразуване?
Дневните или седмичните срокове, които определят курса на даден актив, са полезни за идентифициране на дългосрочни модели. По-кратките интервали (например на всеки пет или 15 минути) улесняват откриването на най-добрите точки за вход и изход.
Current as of August 2026
Markets in 2026 still pay for the same unglamorous skills: reading structure, defining risk before entry, and skipping setups that only work in a backtest. What changed is the environment around those skills — faster options expiry, more retail 0DTE flow, and more prop-firm offers that look like careers but are paid tests. Use this page for the core idea (pattern, strategy, career path, or regulation). Then check current contract specs, firm agreements, and hiring reality before you act on it. Where the original draft treated a past year as “now,” this revision treats August 2026 as now.

