

Updated August 2026. The framework in this article still holds, though some examples and year references had gone stale. It was reviewed in August 2026 so traders can read it as a current guide rather than an archived explainer.
The past often repeats itself, and that is especially true in the stock market. Investors who spend time studying how assets behave under different conditions can often spot similar setups in the current market. A close look at how assets gained and lost value historically can surface consistent patterns that, combined with extra analysis of relevant factors, can support a more accurate read of future performance.
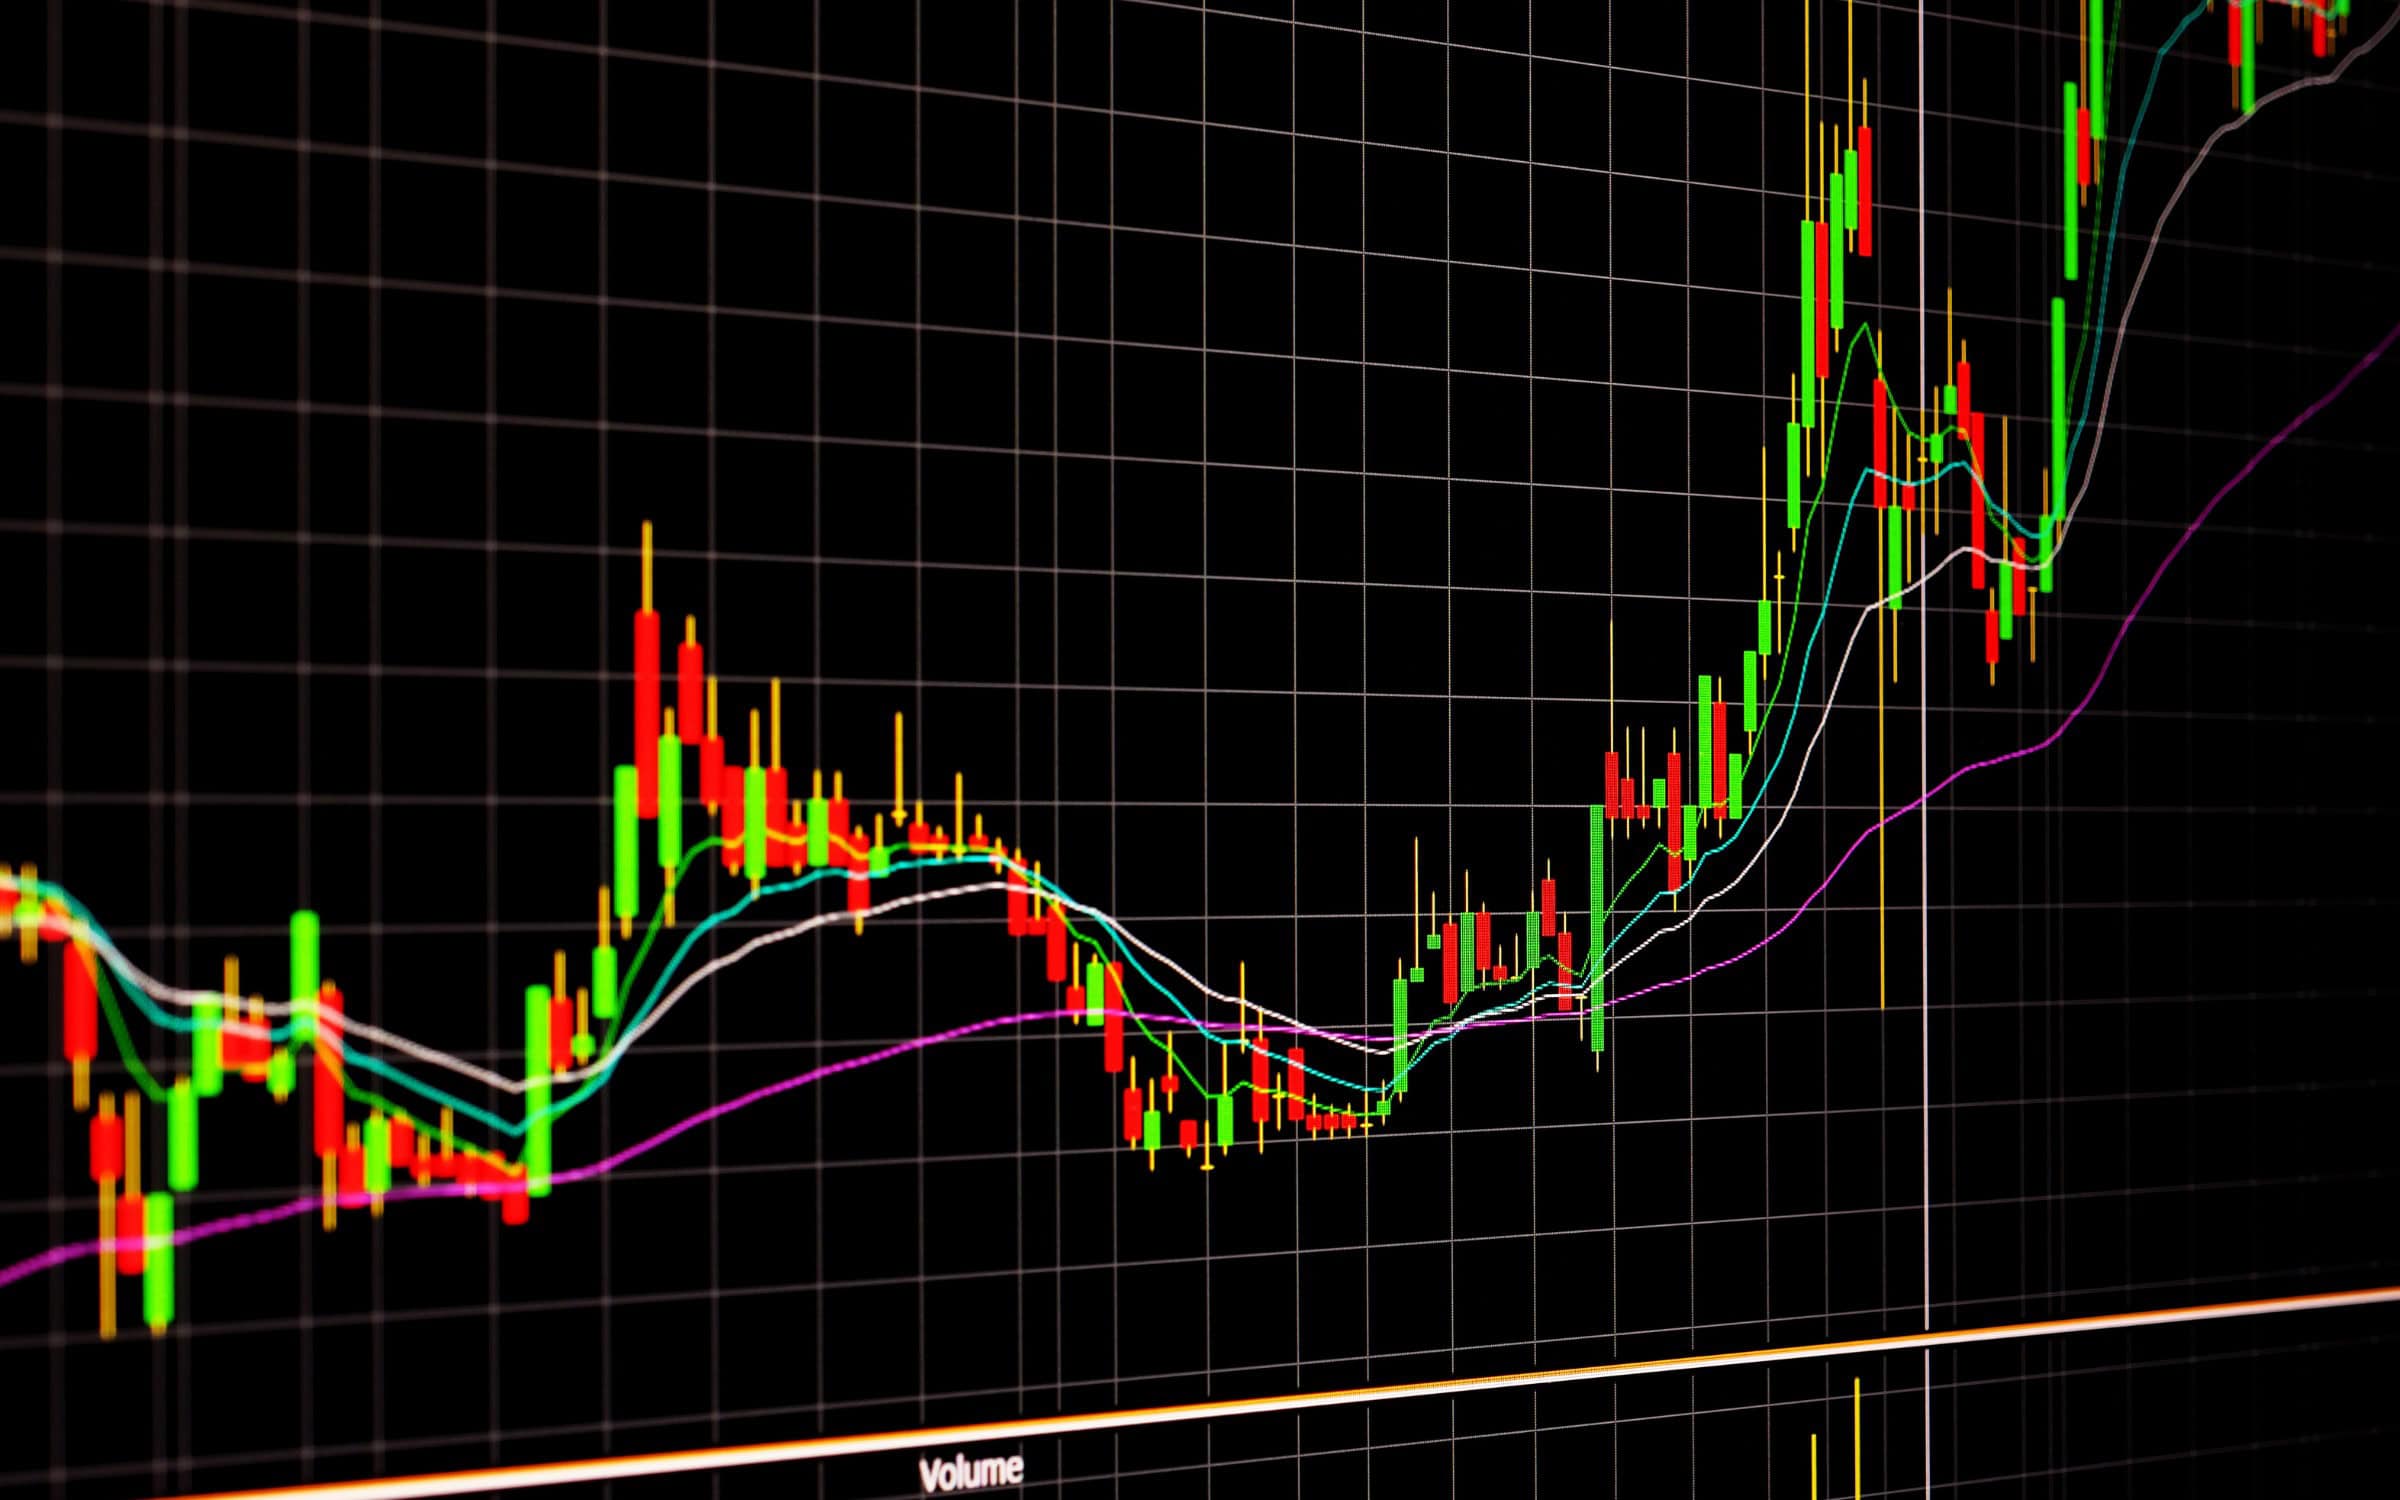
One way to collect that information is to study trading chart patterns. These are shapes that appear on a stock chart and hint at what a given stock might do based on what it did before. Once you can recognize those shapes and what they imply, you can make more informed decisions whether the market is rising or falling.
Black Eagle Financial Group jest jedną z najbardziej szanowanych firm na świecie. własne firmy handlowe w Nowym Jorku. Przygotowaliśmy ten przewodnik, aby opisać najczęściej używane formacje wykresów cenowych i ich znaczenie, abyś mógł wdrożyć je do swoich działań handlowych.
Kategorie wzorców analizy technicznej
Traders study past asset performance using three categories of stock chart patterns. Most assets see each of them at some point.
Kontynuacja
Obecny trend jest na dobrej drodze do kontynuowania tej samej trajektorii.
Odwrócenie
Obecny kurs zmieni kierunek.
Dwustronne
Zmienność na rynku może spowodować zmianę trendu w dowolnym kierunku.
Handel świecami typically relies on trading chart patterns. Traders track candlestick patterns to anticipate market moves using the shape and color of the candlesticks on the chart.
Applying patterns to performance can identify trends, but none are 100% accurate. At most, there’s about an 89% chance that you can make an accurate prediction based on a chart, so investors and traders should never rely entirely on this type of technical analysis as their only tool.
Jak opór i wsparcie wpływają na rozwój formacji
Knowing where support and resistance sit is essential when you build trading strategies around chart patterns.
Wsparcie to poziom, przy którym cena akcji przestaje spadać i rozpoczyna trend wzrostowy. Opór jest przeciwieństwem: wzrost zatrzymuje się, a cena aktywów zaczyna spadać.
Najskuteczniejsze i najdokładniejsze wzorce wykresów wykorzystywane w analizie technicznej
Większość traderów wykorzystuje te wzorce analizy technicznej do analizowania trendów rynkowych:
1. Wchodzenie i schodzenie po schodach
Stock prices do not rise or fall in a straight line. They move in small increments. If they keep heading in one general direction, though, they form an ascending or descending staircase.
Staircases can point to chances to act quickly on short-term market changes. Selling an asset that’s on a general downward trend when it’s experiencing a small upward blip, for example, can limit losses.
2. Głowa i ramiona
A head and shoulders pattern shows a high peak with slightly lower ones on either side. They typically flag a downward reversal because, although each peak falls back to the same support, once the third peak hits that level, the asset usually starts trending lower.
3. Podwójne dno
A double-bottom trend typically flags an upward reversal. It shows up during a stretch of selling that drops the asset to support. Price then moves up toward resistance, falls back to support, and then starts moving higher again in a generally positive direction.
4. Zaokrąglona góra i dół
Rounded top or bottom trading chart patterns also signal reversals. The rounded top is an inverted U that shows assets trending downward, while the rounded bottom is the opposite: a U shape showing an upward trend. These are typically gradual changes that show up over several trading sessions.
5. Proporczyki lub flagi
Stretches of upward momentum followed by consolidation and decline form a pennant or flag on the chart. The pennant shape appears because there is usually an initial burst of large increases followed by smaller fluctuations.
6. Klin
When an asset’s price stays between two sloping support and resistance lines, that is a wedge pattern. A rising wedge has a steeper support line, pointing to a more lasting price decline when it breaks below that line. A falling wedge has a steeper resistance line, showing that the price can keep rising even after it passes that line.
7. Kubek i uchwyt
A cup and handle is a continuation pattern that combines the rounded bottom and wedge patterns. The U of the cup shows a gradual upward trend until the asset goes through a stretch where price declines, but only inside the two parallel lines of a wedge-type graph. Eventually, price tends to break through resistance and resume the upward trend.
8. Trójkąt symetryczny
Watching a symmetrical triangle is useful in a volatile market, because it is a bilateral pattern that can hint at the stock’s overall direction. These triangles form when prices converge as highs get lower and lows get higher.
Może nie być jasnych wskazówek co do tego, w którą stronę poruszy się wartość, zanim utworzy się trójkąt. Jednakże, gdy tak się stanie, należy przygotować się na wybicie w dowolnym kierunku.
Podejmuj najbardziej świadome decyzje handlowe z Black Eagle Financial Group
Łącząc elementy funduszu hedgingowego i firmy świadczącej usługi finansowe, Black Eagle Financial Group stara się pomóc traderom zmaksymalizować ich wyniki dzięki wsparciu, narzędziom i zasobom, które pomagają im rozwijać umiejętności i wznosić inwestycje na nowe wyżyny. Dzięki poradnikom ekspertów, wglądowi w psychologia tradingui wsparcie w celu zabezpieczenia kapitału, zarządzania ryzykiem i zachowania zgodności z przepisami, pomożemy Ci osiągnąć Twoje cele bez nadmiernych kosztów i ryzyka.
Skontaktuj się z nami, dzwoniąc pod numer (833) 253-2453 i dowiedz się więcej o wykorzystywaniu formacji wykresów handlowych jako części zyskownej strategii inwestycyjnej.
Często zadawane pytania
Zapoznaj się z najczęściej zadawanymi pytaniami dotyczącymi formacji wykresów giełdowych i sposobów ich wykorzystania.
Jaki jest najlepszy sposób na naukę formacji wykresów handlowych?
Najlepszym sposobem na nauczenie się rozpoznawania i interpretowania wzorców wykresów handlowych jest porównanie ich z danymi historycznymi, aby zobaczyć, jak ceny zmieniają się w różnych warunkach rynkowych. Użyj algorytmów rozpoznawania wzorców wykresów, aby zastosować różne opcje do poprzednich informacji i zobaczyć, gdzie się pokrywają.
Czy wzorce są dokładne?
Nie, formacje wykresów giełdowych nie zawsze są nieomylne; co najwyżej sprawdzają się w przewidywaniu trendów między 50% a 89% czasu. Mogą pokazywać fałszywe sygnały, więc połącz je z innymi wskaźnikami i metodami analizy, aby uzyskać najbardziej kompletny obraz.
Który wzór jest najlepszy do handlu?
Większość ekspertów zgadza się, że głowa i ramiona to najbardziej wiarygodne formacje wykresów handlowych, szczególnie w przypadku wykrywania odwrócenia trendu.
Jakich ram czasowych używają inwestorzy do identyfikacji wzorców cenowych?
Dzienne lub tygodniowe ramy czasowe, które identyfikują kurs aktywów, są przydatne do identyfikacji długoterminowych wzorców. Krótsze interwały (np. co pięć lub 15 minut) ułatwiają dostrzeżenie najlepszych punktów wejścia i wyjścia.
Current as of August 2026
Markets in 2026 still pay for the same unglamorous skills: reading structure, defining risk before entry, and skipping setups that only work in a backtest. What changed is the environment around those skills — faster options expiry, more retail 0DTE flow, and more prop-firm offers that look like careers but are paid tests. Use this page for the core idea (pattern, strategy, career path, or regulation). Then check current contract specs, firm agreements, and hiring reality before you act on it. Where the original draft treated a past year as “now,” this revision treats August 2026 as now.

